import numpy as np

import drisk as drWorking with Distributions
Elicit, fit, plot, and sample
Overview
Every concrete drisk distribution exposes the same small API:
elicit(...)constructs a distribution from expert-provided inputs,fit(data, ...)estimates distribution parameters from observations,plot(...)gives a quick visual check of the shape, andsample(...)generates Monte Carlo draws.
Elicit from expert judgement
Elicitation is useful when you have estimates rather than raw data. For example, an expert might say that a typical delivery time is expected to fall between 8 and 14 days with 80% confidence.
delivery_days = dr.LogNormal.elicit(
    lower=8,
    upper=14,
    confidence=0.8,
    name="Delivery time, days",
)

delivery_days
LogNormal(dist_type='lognormal', name='Delivery time, days', elicitation_params={'lower': 8, 'upper': 14, 'confidence': 0.8}, params={'mu': 2.359249435647547, 'sigma': 0.2183352597667858})The original elicitation inputs are stored alongside the fitted distribution parameters.
delivery_days.params, delivery_days.elicitation_params({'mu': 2.359249435647547, 'sigma': 0.2183352597667858},
{'lower': 8, 'upper': 14, 'confidence': 0.8})Sample from a distribution
Use .sample() to draw values for a simulation. Pass a seed when you want reproducible examples or tests.
samples = delivery_days.sample(size=10_000, seed=42)
samples[:5]
array([11.31104767, 8.43326695, 12.46717752, 12.99556152, 6.91207347])np.mean(samples), np.percentile(samples, [10, 50, 90])(np.float64(10.817296195999955),
array([ 7.94392525, 10.55262354, 13.99468873]))Plot a quicklook chart
Use .plot() to inspect the distribution before putting it into a model. The plot shows the CDF with a lightly shaded PDF on a secondary axis.
delivery_days.plot(color="steelblue")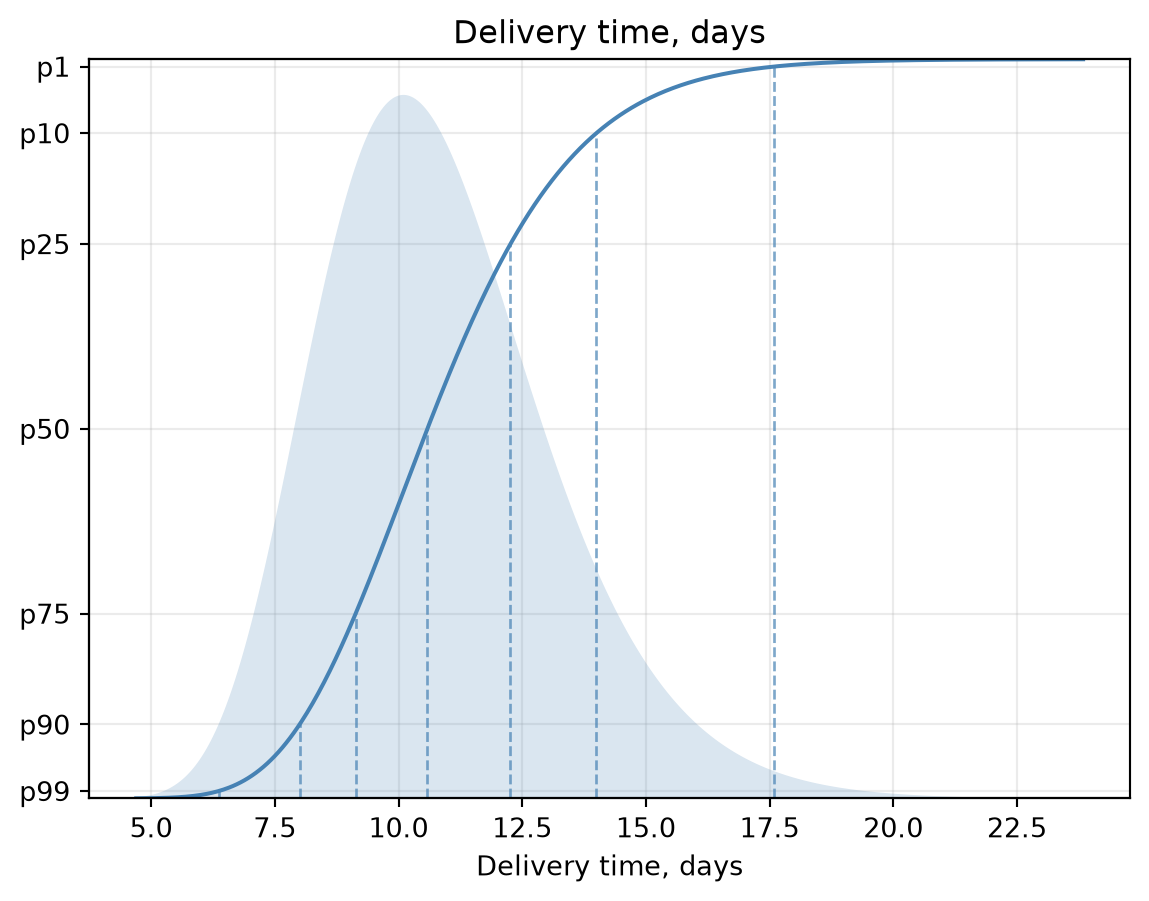
Fit from observed data
When observations are available, use .fit() instead. Here we create a small synthetic dataset and fit a normal distribution to it.
rng = np.random.default_rng(7)
observed = rng.normal(loc=10.5, scale=1.8, size=100)

fitted = dr.Normal.fit(observed, name="Observed delivery time, days")
fitted
Normal(dist_type='normal', name='Observed delivery time, days', elicitation_params=None, params={'mu': 10.188726010859352, 'sigma': 1.5755005786505731})fitted.params{'mu': 10.188726010859352, 'sigma': 1.5755005786505731}You can use fitted distributions the same way as elicited distributions: plot them and sample from them in a Monte Carlo model.
fitted.plot(color="darkorange")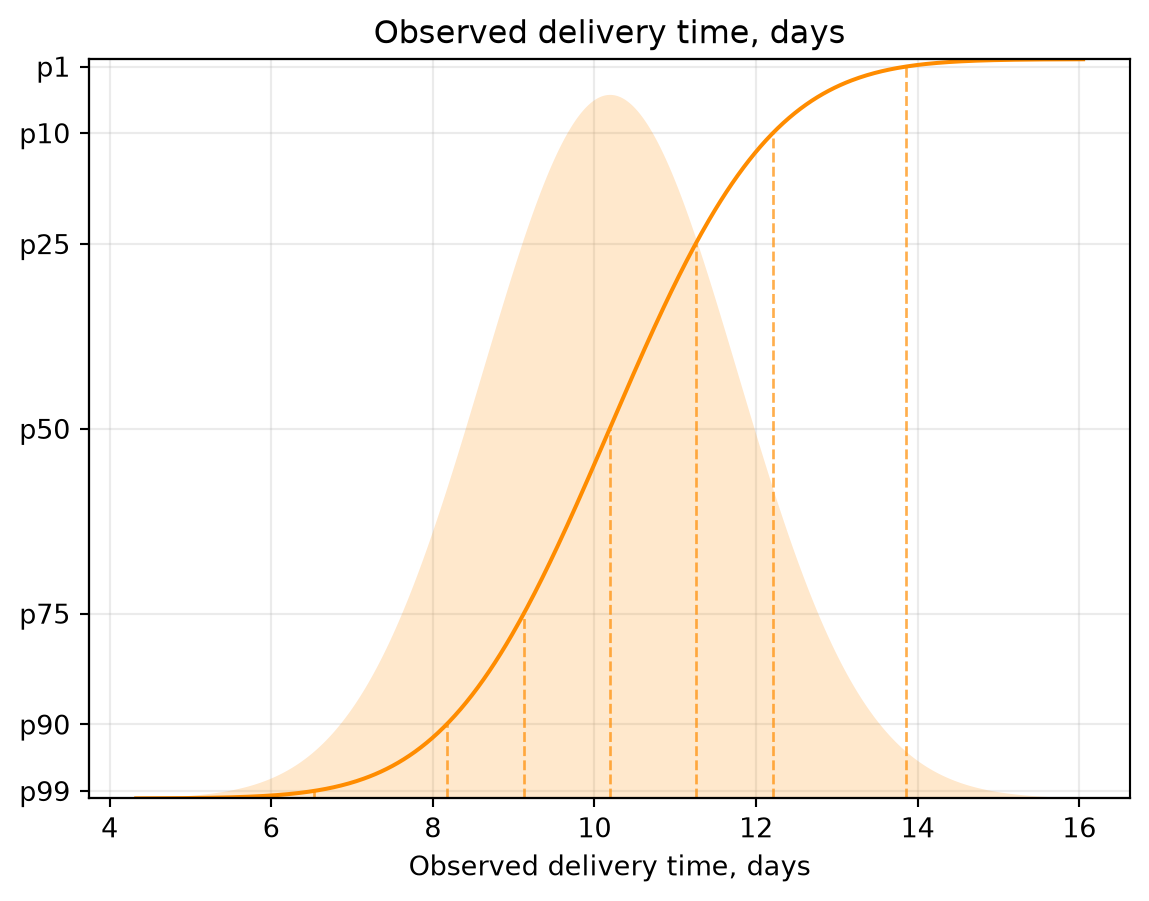
fitted.sample(size=5, seed=123)array([ 8.63036475, 9.60927793, 12.21785301, 10.49433282, 11.63855033])